Machine Learning Foundations: Prediction, Regression, Classification and K-Means
This lesson starts from level zero and moves step by step toward expert understanding. We will learn how machines predict numbers, classify categories, and find groups in data.
📸 Topics Covered (Class Whiteboard)
These are the actual topics we completed in class. This lesson is built directly from this roadmap.
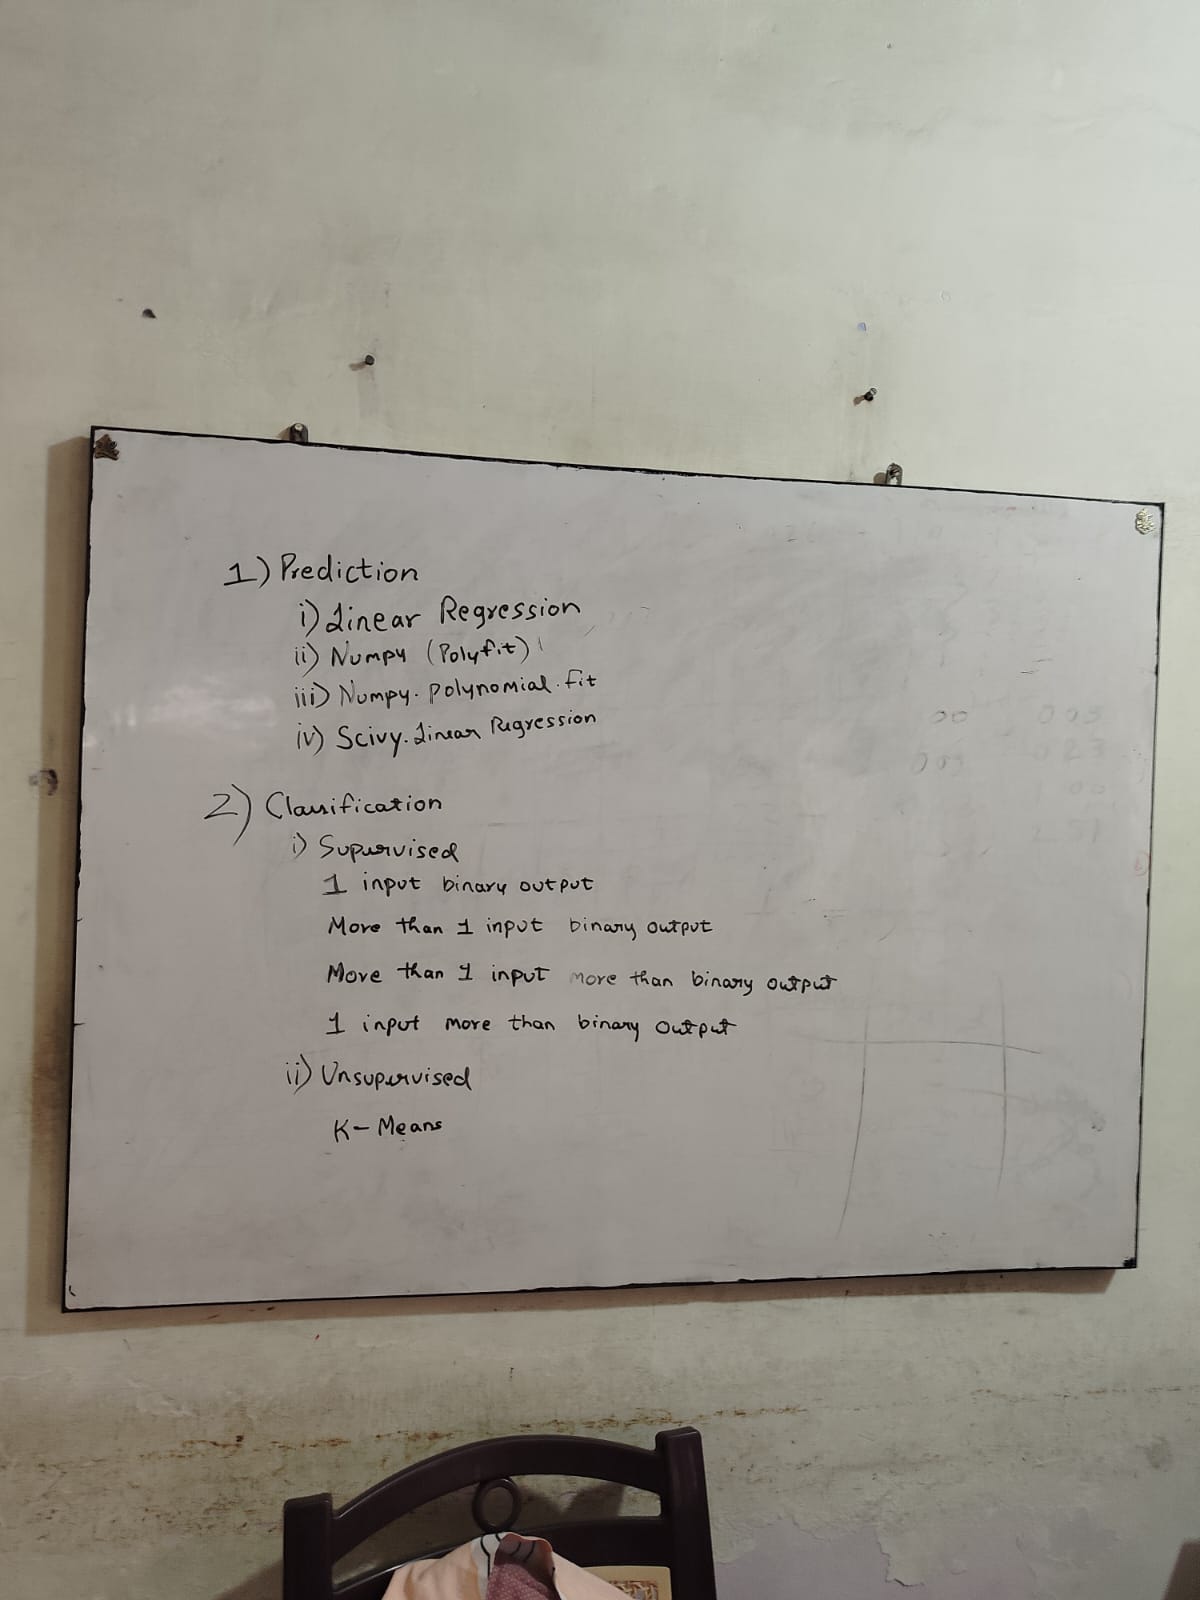
Prediction & Classification Overview
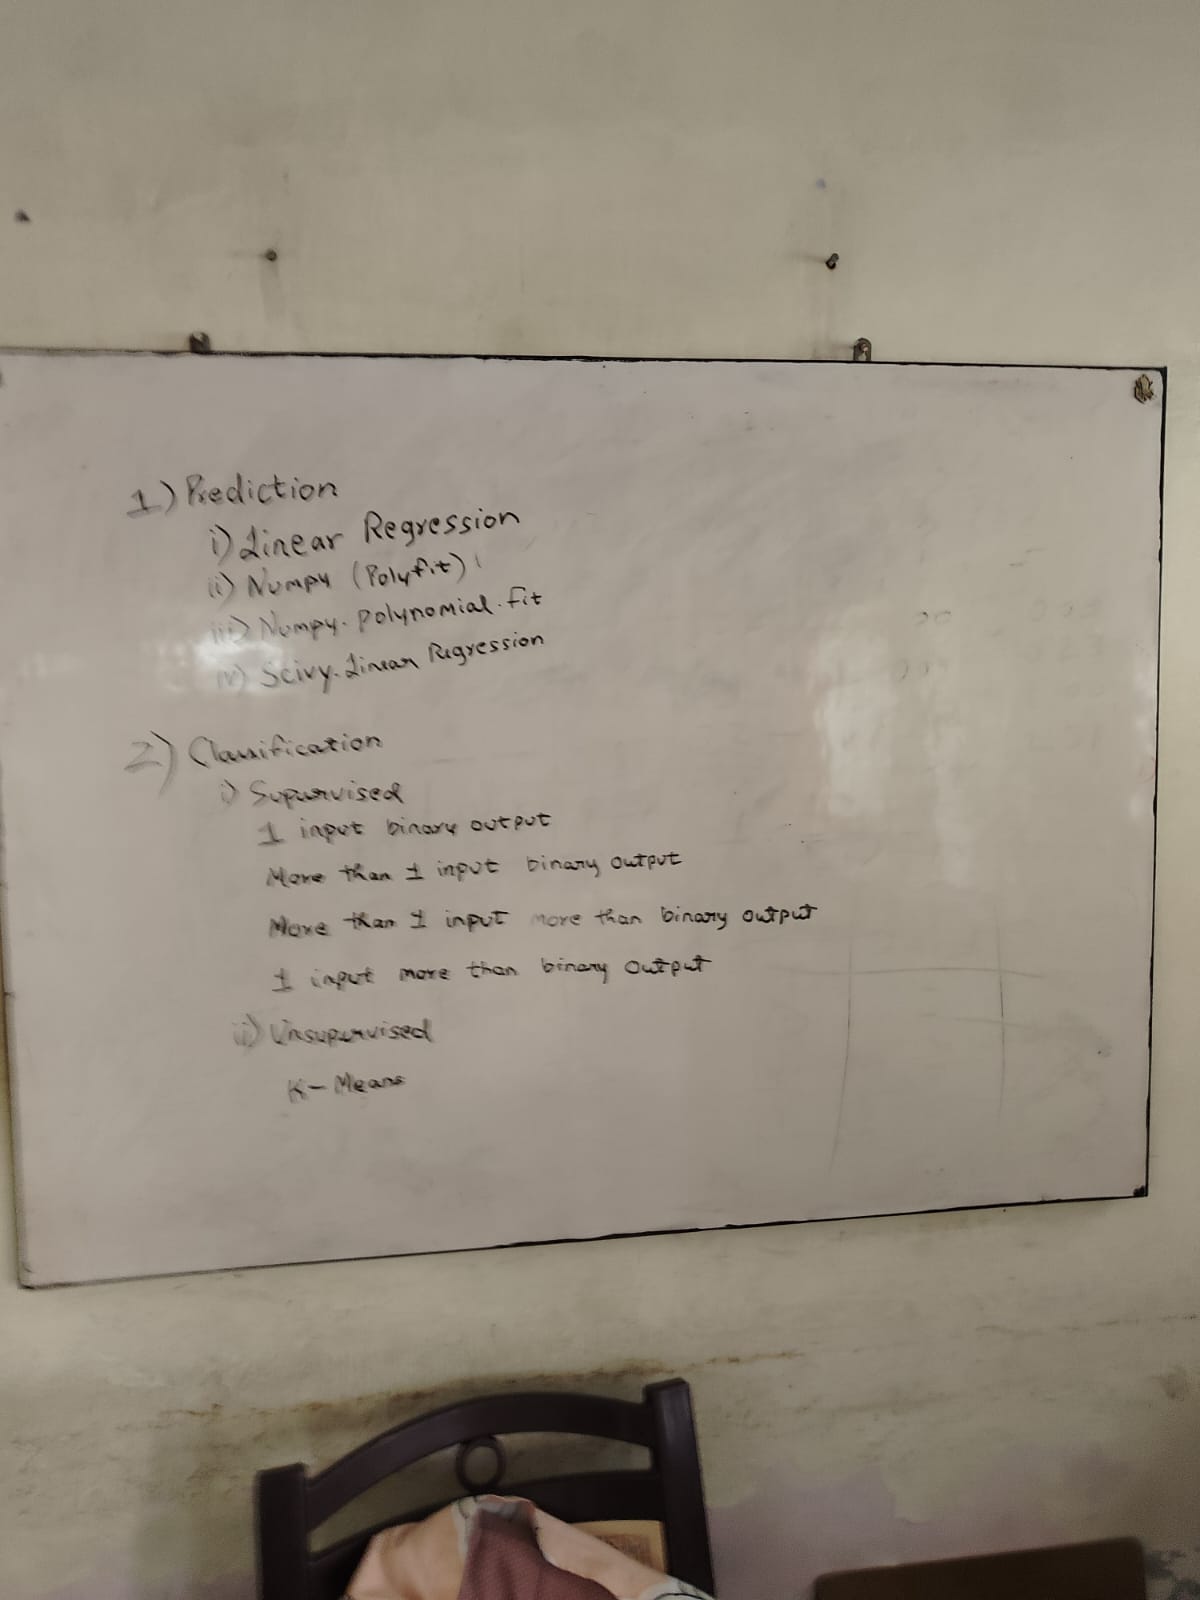
Supervised vs Unsupervised (K-Means)
The Big Picture
Machine Learning means teaching a computer using data instead of writing every rule manually. The computer studies examples and then makes a useful decision.
Three Big Tasks
| Task | Output | Example |
|---|---|---|
| Regression | Number | House price |
| Classification | Category | Spam or not spam |
| Clustering | Hidden group | Customer groups |
1. Prediction
Prediction means estimating a future or unknown value from existing data. In Machine Learning, prediction usually means regression when the answer is a number.
Two simple examples
- Example 1: Study hours → predicted marks.
- Example 2: Temperature → predicted ice cream sales.
2. Linear Regression
Linear Regression draws the best possible straight line through data points. It is used when the relationship looks almost straight.
Here, x is input, y is output, m is slope, and b is intercept.
Two simple examples
- Example 1: More study hours usually means higher marks.
- Example 2: Larger house area usually means higher house price.
Why important?
Linear Regression is often the first real Machine Learning model. It teaches slope, error, prediction, and model fitting.
3. NumPy polyfit
NumPy polyfit can fit a straight line or curve. Degree
1 means linear regression.
import numpy as np

x = np.array([1, 2, 3, 4, 5])
y = np.array([40, 50, 60, 70, 80])

m, b = np.polyfit(x, y, 1)

print("Slope:", m)
print("Intercept:", b)
print("Prediction for 6 hours:", m * 6 + b)
4. Polynomial Fit
Polynomial fit is useful when data is curved instead of straight.
import numpy as np

x = np.array([1, 2, 3, 4, 5])
y = np.array([2, 5, 10, 17, 26])

a, b, c = np.polyfit(x, y, 2)

print(a, b, c)
print("Prediction:", a*6**2 + b*6 + c)
5. SciPy Linear Regression
SciPy linear regression gives slope and intercept, but it also gives statistical values like correlation.
from scipy import stats

x = [1, 2, 3, 4, 5]
y = [40, 50, 60, 70, 80]

result = stats.linregress(x, y)

print("Slope:", result.slope)
print("Intercept:", result.intercept)
print("Correlation:", result.rvalue)
6. Classification
Classification predicts a category. The answer is not a number like price. The answer is a label.
| Type | Input | Output | Example |
|---|---|---|---|
| Binary Classification | 1 or more inputs | 2 classes | Pass / Fail |
| Multi-class Classification | 1 or more inputs | More than 2 classes | A / B / C grade |
Two simple examples
- Example 1: Email → spam or not spam.
- Example 2: Animal image → cat, dog, or cow.
7. Unsupervised Learning and K-Means
In supervised learning, answers are already given during training. In unsupervised learning, answers are not given. The model finds groups by itself.
K-Means is a clustering algorithm. It groups similar points together.
Two simple examples
- Example 1: Group students as beginner, intermediate, and advanced.
- Example 2: Group customers as low spender, medium spender, and high spender.
Expert warning
K-Means needs the value of K. It is also sensitive to outliers and scale. Always normalize data for better clustering.
Regression vs Classification vs Clustering
| Point | Regression | Classification | Clustering |
|---|---|---|---|
| Output | Number | Category | Group |
| Training type | Supervised | Supervised | Unsupervised |
| Example | Price prediction | Spam detection | Customer segmentation |
| Question answered | How much? | Which class? | Which group? |
8. Interactive Graph Lab
Change the dataset and model type. The chart will update automatically.
9. Embedded Python Editor
Practice the same regression and classification examples in the live Python editor.
10. Expert Notes
Linear Regression assumptions
Linear Regression works best when the data has a roughly straight-line relationship, errors are not extreme, and features are not strongly duplicated.
Polynomial Regression danger
A very high degree can memorize training data and fail on new data. This is called overfitting.
Classification boundary
Classification creates a decision boundary. Simple models create simple boundaries. Advanced models create complex boundaries.
K-Means limitation
K-Means works well for round and separated clusters, but it may fail on irregular shapes.
11. MCQ Quiz
Choose the best answer and submit.